Agricultural Policies and the Impact on Plant-based Eating in the U.S.
Agricultural Policies and the Impact on Plant-based Eating in the U.S.
The Farm Bill
The Agriculture Improvement Act of 2018 – AKA the “Farm Bill” – was signed into law on December 20, 2018. This Act is part of the legal framework for agricultural policy that is reconsidered every five years.1 Considerations include farming, nutrition, conservation, rural development, research, and energy. Under the newest Farm Bill, it is now legal to produce hemp, a provision that has experts projecting the American hemp industry to grow by 18.4 percent by the end of 2022.8
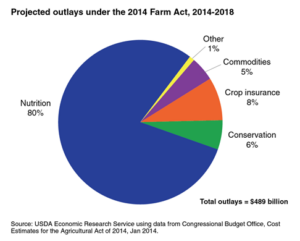
The Agricultural Act of 2014 was signed into law on February 7, 2014. The 2014 Act focused mostly on nutrition, but also funded projects related to crop insurance (8 percent), conservation (6 percent), and commodities (5 percent).1
In the 2014 Farm Bill, key changes were made to:
- Commodity programs
- Crop insurance options
- Conservation programs
- Provisions of the Supplemental Nutrition Assistance Program (SNAP)
- Programs for specialty crops, organic farmers, bioenergy, rural development, and beginning farmers and ranchers
Specialty Crops
Specialty crops are defined by the U.S. Department of Agriculture’s (USDA) Specialty Crop Block Grant Program (SCBGP) as fruits, vegetables, tree nuts, dried fruits, horticulture, and nursery crops.2 However, specialty crops are differentiated from federally supported commodity crops like grains, corn, soybeans, cotton, rice, and barley.2
Most programs supporting specialty crops were piloted in the 2002 farm bill and established in the Specialty Crops Competitiveness Act of 2004 and future farm bills. In 2012, the value of farm-level specialty crop production totaled nearly 60 billion dollars – 25 percent of the value of U.S. crop production.3

State Indicator Report on Fruits and Vegetables 2018
According to a CDC report describing the status of fruit and vegetable access and production across each state in the United States, only 12.2 percent of adults meet daily fruit intake recommendations and 9.3 percent the daily vegetable intake recommendation.5 These percentages are even smaller for adults who live at or below the poverty level.
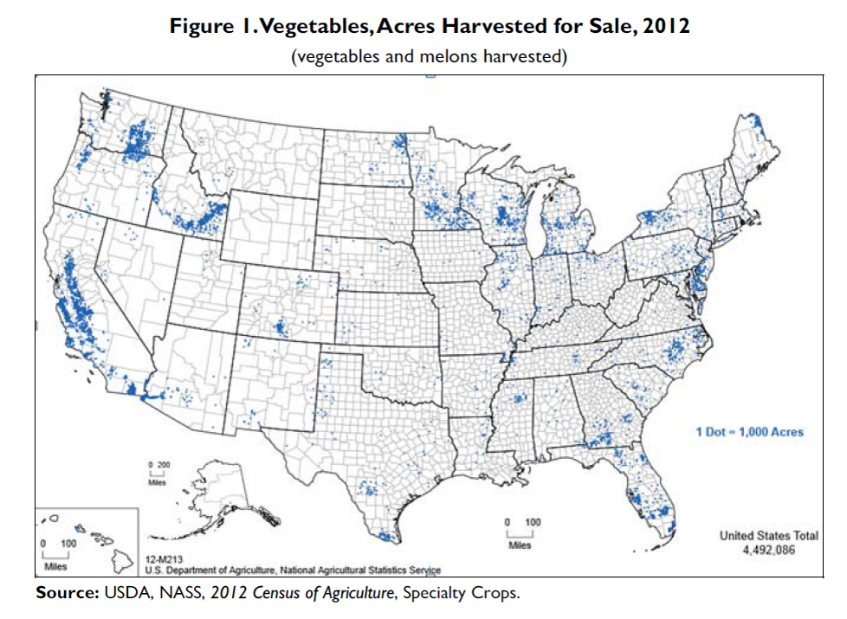
The CDC considers this lack of fruit and vegetable intake a serious issue because these plant-based foods provide important nutrients for supporting healthy body function and preventing illness and disease. To successfully improve the number of adults meeting fruit and vegetable daily intake recommendations, the CDC states that fruits and vegetables need to be accessible and affordable. However, less than 10 percent of American cropland is utilized for specialty crops that include most fruits and vegetables.
Organic farms and other farmland devoted to growing specialty crops have a large impact on healthy food choices. The more specialty crops that are produced on farms, the more accessible these crops are in grocery stores across the country. And as more specialty crops become available for Americans, the chances get better for an increase in the number of individuals who meet daily fruit and vegetable intake recommendations.
Powerhouse Fruits and Vegetables
Many different specialty crops were featured in a 2014 CDC study, where researchers collated a comprehensive list of “powerhouse fruits and vegetables” (PVF).6 Researchers calculated a nutrient density score for each food, calculated by averaging percent daily values for qualifying nutrients. At the end of the study, all of the foods identified as PFV were those classified as specialty crops.
This study highlights the importance of specialty crops (although they are federally underfunded), as the study indicates that PVFs provide, on average, 10 percent or more daily value (per 100 kilocalories) of 17 qualifying nutrients:
- Potassium
- Fiber
- Protein
- Calcium
- Iron
- Thiamin
- Riboflavin
- Niacin
- Folate
- Zinc
- Vitamins A, B6, B12, C, D, E, and K
| TOP 10 POWERHOUSE FRUITS & VEGETABLES* | ||
| Food | CDC Nutrient Density Score | Considered as a specialty crop? |
| Watercress | 100 | Yes |
| Chinese cabbage | 91.99 | Yes |
| Chard | 89.27 | Yes |
| Beet green | 87.08 | Yes |
| Spinach | 86.43 | Yes |
| Chicory | 73.36 | Yes |
| Leaf lettuce | 70.73 | Yes |
| Parsley | 65.59 | Yes |
| Romaine lettuce | 63.48 | Yes |
| Collard green | 62.49 | Yes |
| *According to 2014 CDC study | ||
The USDA found that spending on food away from home (FAFH) surpassed spending on food at home (FAH) for the first time in 2010, increasing its share of total food spending from 44 percent (30 years prior) in 1987 to 50.2 percent in 2010.7 The USDA reports that the fat content of FAFH is significantly higher than that of FAH. On average, FAH also has less calories than FAFH. Additionally, density of key nutrients like calcium, iron, and fiber are lower in FAFH than in FAH.
The disparity in nutrient density between FAFH and FAH illustrates how important it is to make smart food choices centered around plant-based options, like the key powerhouse fruits and vegetables highlighted by the CDC and defined as “specialty crops” by the USDA. The bottom line? Plant-based, whole foods provide the vital nutrients every individual needs to be healthy.
- US Department of Agriculture Economic Research Service. (2018).Agricultural act of 2014: Highlights and implications. USDA ERS – Food Environment Atlas. Retrieved from usda.gov/agricultural-act-of-2014-highlights-and-implications/.
- United States Department of Agricultural Marketing Service. (n.d.) What is a specialty crop? Retrieved from https://www.ams.usda.gov/services/grants/scbgp/specialty-crop.
- Johnson, R. (2014). Specialty crop provisions in the 2014 farm bill (P.L. 113-79) Retrieved from http://nationalaglawcenter.org/wp-content/uploads/assets/crs/R43632.pdf
- Plumer, B. (2014). The $956 billion farm bill, in one graph. The Washington Post. Retrieved from https://www.washingtonpost.com/news/wonk/wp/2014/01/28/the-950-billion-farm-bill-in-one-chart/?utm_term=.ddea4f5514a7.
- CDC. (2018). 2018 state indicator report on fruits and vegetables. https://www.cdc.gov/nutrition/downloads/fruits-vegetables/2018/2018-fruit-vegetable-report-508.pdf.
- Di Noia, J. (2014). Defining powerhouse fruits and vegetables: A nutrient density approach. Preventing Chronic Disease, 11.
- US Department of Agriculture. (2018). America’s eating habits: Food away from home.
- Boyte, C. (2018). U.S. hemp CBD market to triple by 2022. Retrieved from https://newfrontierdata.com/cannabis-insights/u-s-hemp-cbd-market-to-triple-by-2022/


